Statistical Cancer Genomics
Statistical Cancer Genomics
Cancer is not a single, uniform enemy. It is more like a restless city of cells that continually splinters into rival neighbourhoods. Scientists call this built-in diversity heterogeneity, and it appears at three main levels:
- Inter-patient heterogeneity: Every person’s tumour
begins its journey with a different suitcase of DNA glitches.
- Inter-tumour heterogeneity: A secondary growth in
another organ can follow its own genetic path.
- Intra-tumour heterogeneity: Even a small biopsy contains several competing sub-clones, all jostling for space and resources.
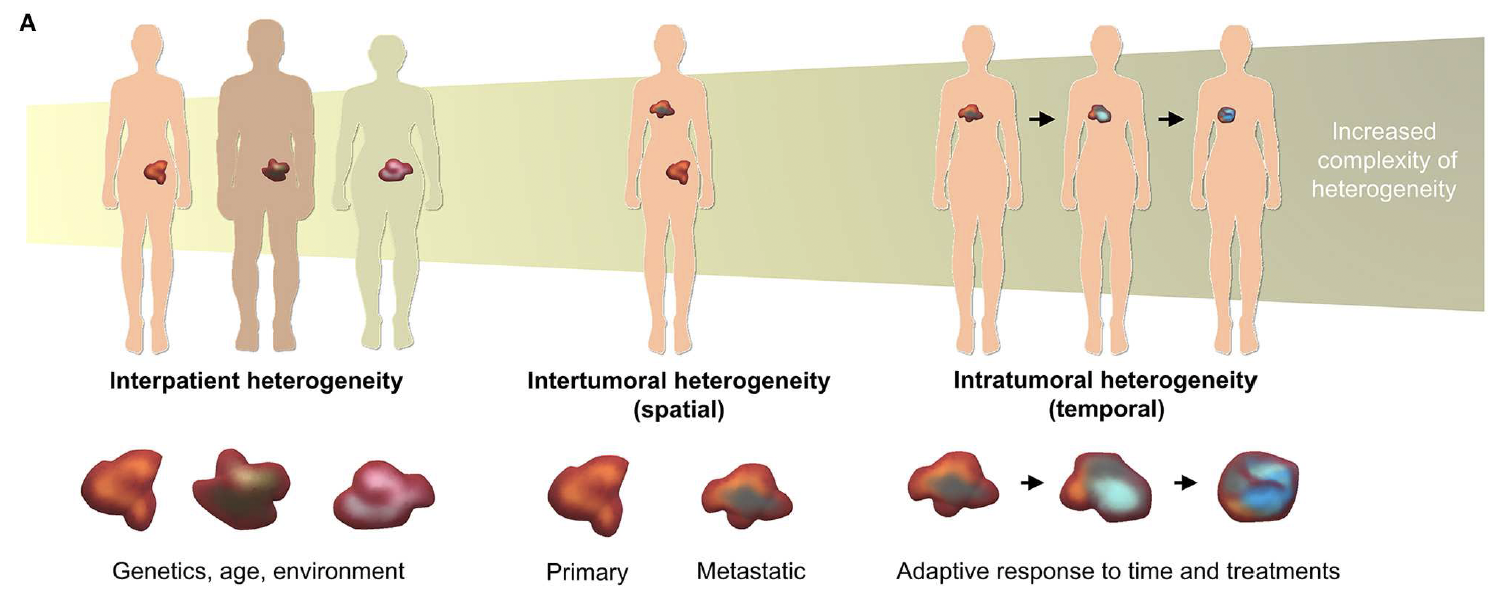
Figure 1. Levels of tumour heterogeneity. Adapted from Bray et al. (2019).
While at the Ewing Group, I served as a genetic map-maker for cancer DNA in High-Grade Serous Ovarian Cancer patients. We read all the genetic letters in a tumour sample and, with smart computer methods, turned that tangled code into a simple roadmap showing which groups of cancer cells existed, how they were related, and how the tumour had grown over time.
Captured every voice in the crowd
Sequencing produced a chorus of overlapping genetic ‘voices’. My first task was to spot which mutations travelled together, hinting they came from the same sub-clone.Separated the overlapping stories
By clustering these linked mutations, I teased apart distinct branches of the tumour’s family tree and measured how common each branch was—quantifying intra-tumour heterogeneity rather than guessing at it.Rewound the evolutionary timeline
Distinguishing shared (early) from branch-specific (later) mutations allowed me to reconstruct the order of events: which DNA mishaps launched the first rogue cell, which twists gave descendants new survival tricks, and when aggressive traits emerged.Translated the map into clinical insight
- Spotted groups of different cancer cells occuring different
timeframes in tumour evolution, guiding smarter therapy choices.
- Identified distinct tumour-evolution patterns across patients,
enabling personalised treatment.
- Pinpointed when major genetic shake-ups—such as the sudden doubling of all DNA in a cell—occurred during tumour development, improving prognosis and informing therapy selection.
- Spotted groups of different cancer cells occuring different
timeframes in tumour evolution, guiding smarter therapy choices.
These studies are part of ongoing research and are not yet
published.
References:
Bray, Laura J., Dietmar W. Hutmacher, and Nathalie Bock. “Addressing patient specificity in the engineering of tumor models.” Frontiers in bioengineering and biotechnology 7 (2019): 217.